Calculus III
Contents
3 Dimensional space
Partial derivatives
Multiple integrals
Vector Functions
Line integrals
Surface integrals
Vector operators
Applications
© The scientific sentence. 2010
|
|
Calculus III:
Vector functions  (t) (t)
Definitions and graphs
1. Defnitions
A vector function is a function that takes one or more variables and returns a vector.
We�ll consider vector functions of a single variable and vector functions of two variables.
A vector function of a single variable in and and have the following respective forms:
 (t) = (f(t), g(t)) and (t) = (f(t), g(t)) and
 (t) = (f(t), g(t), h(t)) (t) = (f(t), g(t), h(t))
(f(t), g(t), h(t)) are the component functions.
t is a real parameter.
The first component function gives the x coordinate, the second component
function gives the y coordinate, and the third component
function gives the z coordinates of the point that we graph.
2. Examples
 (t) = (2sin(t), √(x - 5), √(3 - x)) is a vector
function. What is its domain? (t) = (2sin(t), √(x - 5), √(3 - x)) is a vector
function. What is its domain?
The domain of a vector function is the set of all t�s for which all the
component functions are defined.
The first component 2sin(t) is defined over , in
the second component
√(x - 3): x ≥ 3, and
in the third √(5 - x): x ≤ 5. Hence the domain is the interval [3, 5]. , in
the second component
√(x - 3): x ≥ 3, and
in the third √(5 - x): x ≤ 5. Hence the domain is the interval [3, 5].
3. Graphing a vector function
Example 1
Graphing a vector function consists of drawing the position vectors
for each point on the graph. The a position vector , say (a, b, c) , is a vector that starts at the origin and ends at the point (a, b, c). (a, b, c) , is a vector that starts at the origin and ends at the point (a, b, c).
The method to graph a vector function is to choose values of the parameter t
to get the components of the corresponding vector position we get out
of the vector function.
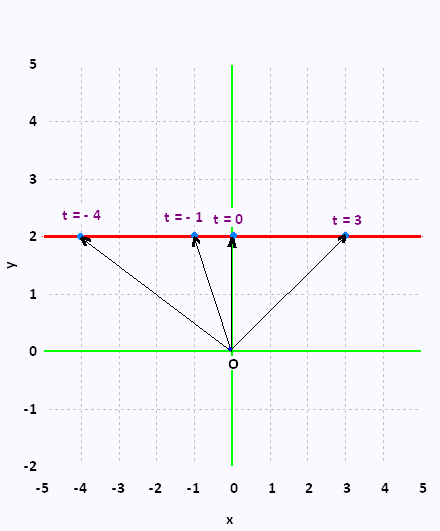
Sketch the graph of the vector function  (t) = (t, 2) (t) = (t, 2)
Some values of t give us some position vectors:
 (-4) = (- 4, 2), (-4) = (- 4, 2),  (-1) = (-1, 2), (-1) = (-1, 2),
 (0) = (0, 2), and (0) = (0, 2), and  (3) = (3, 2). (3) = (3, 2).
Then the points (- 4, 2), (-1, 2), (0, 2), and (3, 2) are all on the graph
of this vector function.
Here is a sketch of this vector function:

The graph of the vector function (t) = (t, 2) is
a line . (t) = (t, 2) is
a line .
Example 2
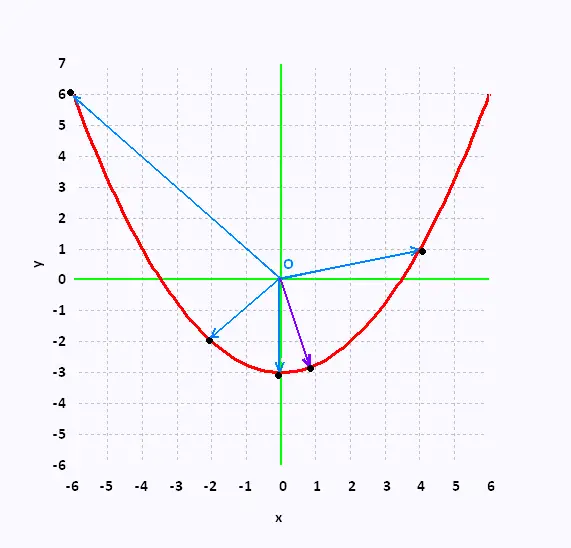
Sketch the graph of the vector function  (t) =
(2t, t2 - 3) (t) =
(2t, t2 - 3)
Some values of t give us some position vectors:
 (-3) = (- 6, 6), (-3) = (- 6, 6),  (-1) = (-2, -2), (-1) = (-2, -2),
 (0) = (0, -3), and (0) = (0, -3), and  (2) = (4, 1). (2) = (4, 1).
Then the points (- 6, 6), (-2, -2), (0, -3), and (4, 1) are all on the graph
of this vector function.
Here is a sketch of this vector function:

The graph of the vector function  (t) =
(2t, t2 - 3) follows the graph of the second component t2 - 3,
that is an hyperbola. (t) =
(2t, t2 - 3) follows the graph of the second component t2 - 3,
that is an hyperbola.
Example 3
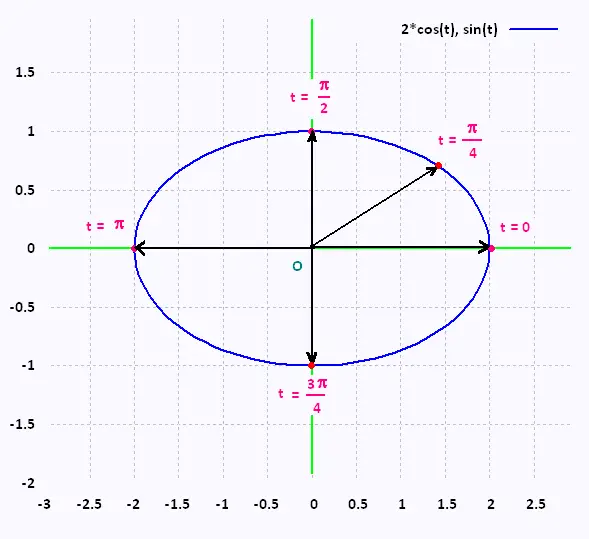
Sketch the graph of the vector function  (t) =
(2*cos(t), sin(t)) (t) =
(2*cos(t), sin(t))
Some values of t give us some position vectors:
 (0) = (2, 6), (0) = (2, 6),  (π/2) = (0, π/2), (π/2) = (0, π/2),
 (π) = (- 2, 0), and (π) = (- 2, 0), and  (3π/4) = (0, -1). (3π/4) = (0, -1).
Then the points (2, 6), (0, π/2), (- 2, 0), and (0, -1) are all on the graph
of this vector function.
Here is a sketch of this vector function:

The graph of the vector function (t) =
(2*cos(t), sin(t)) is an ellipse. (t) =
(2*cos(t), sin(t)) is an ellipse.
4. vector functions in R3
The three dimensional vector function (t) = (f(t), g(t), h(t))
can be broken down into the parametric equations =
x = f(t), y = g(t), and z = h(t). (t) = (f(t), g(t), h(t))
can be broken down into the parametric equations =
x = f(t), y = g(t), and z = h(t).
Examples
1) The graph of the vector function (t) = (1 + 3t, - 2 + t, - 5 - 2t)
is a line that passes by the point (1, -2, -5), and having (t) = (1 + 3t, - 2 + t, - 5 - 2t)
is a line that passes by the point (1, -2, -5), and having  = (3, 1, - 2) as the parallel vector. = (3, 1, - 2) as the parallel vector.
2) The graph of the vector function (t) = (3sin(t)), 3cos(t), 4)
gives a circle, of radius 3, centred at the origin, parallel to the xy-plane and located at z = 3. (t) = (3sin(t)), 3cos(t), 4)
gives a circle, of radius 3, centred at the origin, parallel to the xy-plane and located at z = 3.
3) Likewise, the graph of the vector function (t) = (3sin(t)), 4, 3cos(t))
gives a circle, of radius 3, centred at the origin, parallel to the xz-plane and located at y = 4. (t) = (3sin(t)), 4, 3cos(t))
gives a circle, of radius 3, centred at the origin, parallel to the xz-plane and located at y = 4.
4) The graph of the vector function (t) = (3sin(t)), 3cos(t), t)
gives a helix (or spiral), of radius 3, centred at the origin, parallel to the xz-plane along the z-axis. (t) = (3sin(t)), 3cos(t), t)
gives a helix (or spiral), of radius 3, centred at the origin, parallel to the xz-plane along the z-axis.
5) The graph of the vector function (t) = (3sin(t)), t, 3cos(t))
is a helix that rotates around the y-axis, and the graph of the vector function (t) = (3sin(t)), t, 3cos(t))
is a helix that rotates around the y-axis, and the graph of the vector function (t) = (t, 3sin(t)), 3cos(t)) is a helix that rotates around the x-axis. (t) = (t, 3sin(t)), 3cos(t)) is a helix that rotates around the x-axis.
|
|