Precalculus: Exponentials and logarithms
1. Definitions: logarithms and exponentials properties
if y = ax , then x = loga(y)
The real positive a is called the base of the logarithm.
If a = 1, then y = 1x = 1 in ]-∞, + ∞[
If a < 0, then y = ax will have no sense when x
is rational (for example (-6)1/2)
Conclusion a must be real positive.
2. Properties
loga (x y ) = loga (x) + loga (y)
loga (x/y) = loga (x) - loga(y)
loga ax = x
To change the base from one to another:
loga (x) = logb (x) . loga (b)
Other properties:
loga (a) = 1
loga (1) = 0
loga (ax) = x
a loga(x) = x
loga (xr) = r loga (x)
3. Examples
y = 2x , then x = log2 (y)
y = 10x , then x = log10 (y) = log (x)
called common logarithm.
y = ex , then x = loge y = ln (y)
called natural logarithm.
ln (2) = 0.69
log (10) = 1
log (1/2) = - log 2
4. Exercises
Simplify the following expressions:
ln(a2 b3 c-7)
ln(4 a2/b3/4)
log[4 a3/(b2- 1)]
Solutions
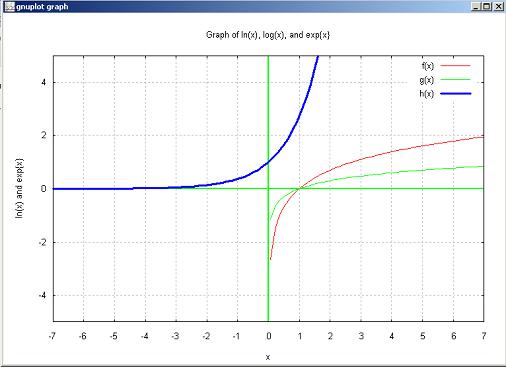
5. Graph of ln(x), log(x) and exp{x}

gnuplot> set border
gnuplot> set xtics 1
gnuplot> set grid
gnuplot> set xzeroaxis lt 2 lw 2
gnuplot> set yzeroaxis lt 2 lw 2
gnuplot> set style line 1 lw 3
gnuplot> set xrange [-7:7]
gnuplot> set yrange [-5:5]
gnuplot> f(x)= log(x); g(x)= log10(x); h(x) = exp (x);
gnuplot> set title "Graph of ln(x), log(x), and exp{x}"
gnuplot> set xlabel " x "
gnuplot> set ylabel "ln(x) and exp{x}"
gnuplot> plot f(x), g(x), h(x) lw 3
|