Quantum Mechanics
Schrodinger equation
Quantum Mechanics
Propagators : Pg
Quantum Simple Harmonic
Oscillator QSHO
Quantum Mechanics
Simulation With GNU Octave
© The scientific sentence. 2010
|
|
Quantum Mechanics
Programming in GNU Octave
Heaviside potential
Wave packet with Heaviside potential
%***************************************
%personal
%addpath("C:/Octave/Octave-4.0.0/myfiles");
%wp
% © TheScientificSentence
%****************************************


%*********************************************************
%  Gaussian wavepacket propagation using  GNU Octave (or MatLab)
%*********************************************************


% Clearing

clc
clf
clear all


% Related  Parameters in the interval 0 < x < L

L = 100; %  Length of the inteval [0,L]
N = 400; % Number of points of in this interval
x = linspace(0,L,N)'; % Length vector
dx = x(2) - x(1); %Length step


% related parameters for intial momentum in k-space
ko = 2; % Peak of  momentum
a = 20; % Momentum  parameter
dk = 2*pi/L; % Momentum step
ml = N*dk; % Momentum limit
k = linspace(0,+ml,N)'; % Momentum vector


%  Computing psi(x,0) From Gaussian kspace wavefunction phi(k)  using
% fast fourier transform :
phi = exp(-a*(k-ko).^2).*exp(-i*6*k.^2); % unnormalized phi(k)
psi = ifft(phi); % multiplies phi by exp ikx and integrates vs. x
psi = psi/sqrt(psi'*psi*dx); % normalize the psi(x,0)


% Expectation value of energy
%avgE = phi'*0.5*diag(k.^2,0)*phi*dk/(phi'*phi*dk);
U = heaviside(x-(L/2));  % free particle wave packet evolution
e = ones(N,1);
d = spdiags([e -2*e e],[-1 0 1],N,N)/dx^2;
H = -(1/2)*d + spdiags(U,0,N,N);

% Parameters for computing psi(x,t)  in the interval 0 < t < Tc
% ----------->
Ns = 100; % Number  of time steps
Tc = 10;
T = linspace(0,Tc,Ns); % Time vector
dT = T(2)-T(1); % Time step
hbar = 1;


% Time displacement operator E=exp(-iHdT/hbar)
E = expm(-i*full(H)*dT/hbar); % time desplacement operator


% Simulate P(x,t) and plot for each t
for t = 1:Ns; % time  for loop
psi = E*psi; % calculate new psi from old psi
P = conj(psi).*psi; % P(x,t)
plot(x,P,'k'); % plot P(x,t) vs. x
axis([0 L 0 0.15]); % set x,y axis parameters for plotting
xlabel('x (m)', 'FontSize', 14);
ylabel('probability density p(x) (1/m)','FontSize', 14);
pause(0.05); % pause between each frame displayed
end


% ------------------------


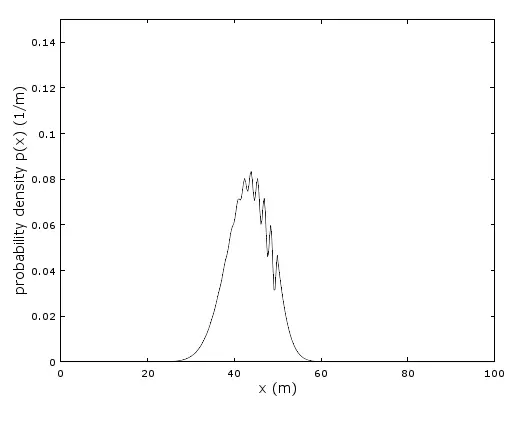
The output at a certain time :

|
|